The second week of the SideHustle 5.0 Bootcamp started on a high note for my teammates and me. We were ready to tackle our task for the week head-on and complete it as soon as possible. However, we couldn't get our hands on the required datasets not to even talk about getting our hands dirty.
We continued foraging deep in the popular jungle called the world wide web using various search engines. Along the way, we encountered some interesting datasets on various diseases. Finally, we found datasets on COVID-19 and HIV/AIDS. At one point we even had more datasets than we knew what to do with (winks).
Now comes the challenge of picking the dataset that suits our needs. The team had a lively discussion about this during our daily meeting and each member gave their opinion. We eventually agreed and picked our dataset.
Next was to clean the data and visualize it. I volunteered to clean the data to make the work faster. After cleaning, I uploaded the data in excel format on the drive shared by all the team members. At this point, the Power BI team was ready to flex their muscles and show their visualization skills.
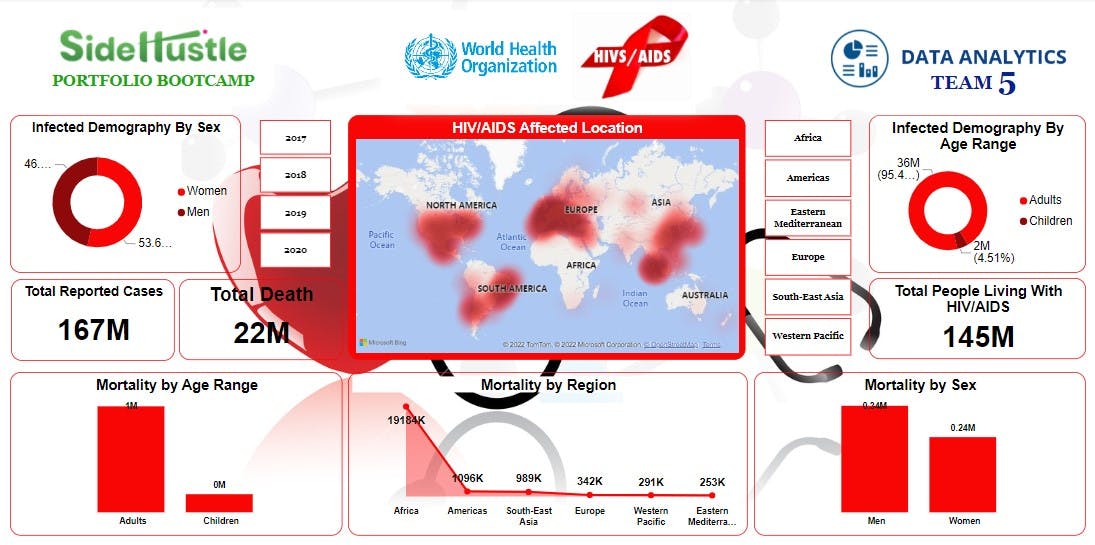
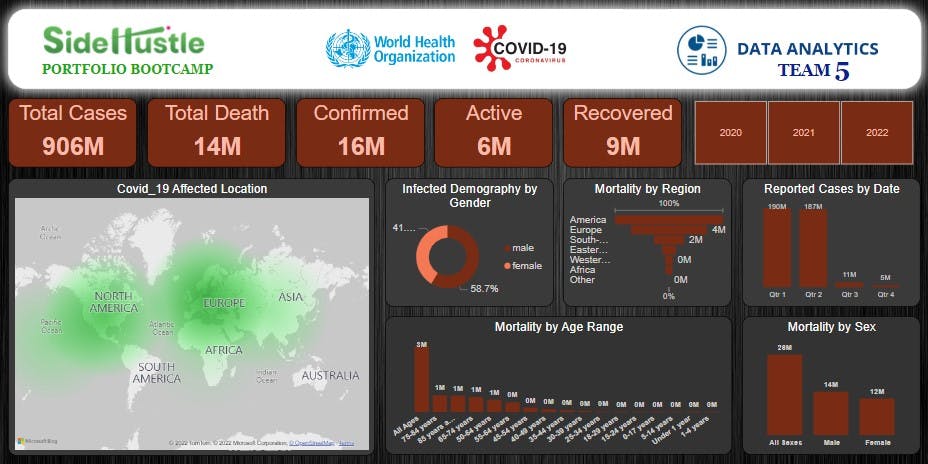
Kudos to all team members for the beautiful visualization (see below). We were able to give various insights on COVID-19 and HIV/AIDS using the data from WHO (World Health Organization).
 HIV/AIDS Dashboard
 Covid'19 Dashboard
All in all, we had another successful week in the Bootcamp. Looking forward to the challenge for week 3. Cheers!
